SOUTH-EAST REGION
ECONOMY
GROSS-DOMESTIC PRODUCT
In 2013, the South-Eastern region generated 9, 2% of the GDP in the Republic of Macedonia. Compared to the average GDP per capita in the Republic of Macedonia (index=100), the South-Eastern region has an index of 109, 6 taking the third position after the Skopje region, that has an index of 143, 5, and the Vardar region with 110, 6. The gross-domestic product per capita is 266.524 denars and is above the average of the Republic of Macedonia.
Table: Gross-domestic product (in MKD)
|
|
Gross domestic product (in million denars) |
Gross domestic product per capita (in denars) |
Structure of gross-domestic product |
Gross domestic product per capita MK= 100 |
|---|---|---|---|---|
|
Republic of Macedonia |
501.891 |
243.161 |
100,0 |
100,0 |
|
Vardar |
41.260 |
268.819 |
8,2 |
110,6 |
|
East |
40.449 |
226.898 |
8,1 |
93,3 |
|
South-West |
39.378 |
178.726 |
7,8 |
73,5 |
|
South-East |
46.211 |
266.524 |
9,2 |
109,6 |
|
Pelagonia |
56.530 |
243.279 |
11,3 |
100,0 |
|
Polog |
37.735 |
118.672 |
7,5 |
48,8 |
|
North-East |
26.613 |
151.462 |
5,3 |
62,3 |
|
Skopje |
213.715 |
348.915 |
42,6 |
143,5 |
Source: State Statistical Office, 2015
Table: Gross- investment in basic assets, by regions, 2013
|
Milion denars |
Structure (%) | |
|---|---|---|
|
Republic of Macedonia |
119.003 |
100,0 |
|
Vardar |
8.179 |
6,9 |
|
East |
10.462 |
8,8 |
|
South-West |
5.597 |
4,7 |
|
South-East |
6.390 |
5,4 |
|
Pelagonia |
10.745 |
9,0 |
|
Polog |
7.558 |
6,4 |
|
North-East |
2.482 |
2,1 |
|
Skopje |
67.589 |
56,8 |
Source: State Statistical Office, 2015
Observed by regions, according to the total investments in basic assets, the South-East region is on the fifth place with participation of 5, 4% (2013).
ACTIVE BUSINISS ENTITIES
Figure: Active business entities (2014)
{flashchart data="2009,2010,2011,2012,2013,2014/3142,3373,3961,4472,4183,4077|2837,3057,2235,1839,1825,1807|45,49,43,46,51,59|9,9,8,16,24,26" type="bar_simple" tooltip="#x_label#: #val#
>Total #total#" title="Active business entities" height="300" dimension="" label_fontsize="11" x_label_rotate="40" x_step="1" legend="Micro,Small,Medium,Large" right_legend="0" bg_image="plugins/content/flashchart/images/pv_system.jpg"}sample04{/flashchart}
Source: State Statistical Office, 2015
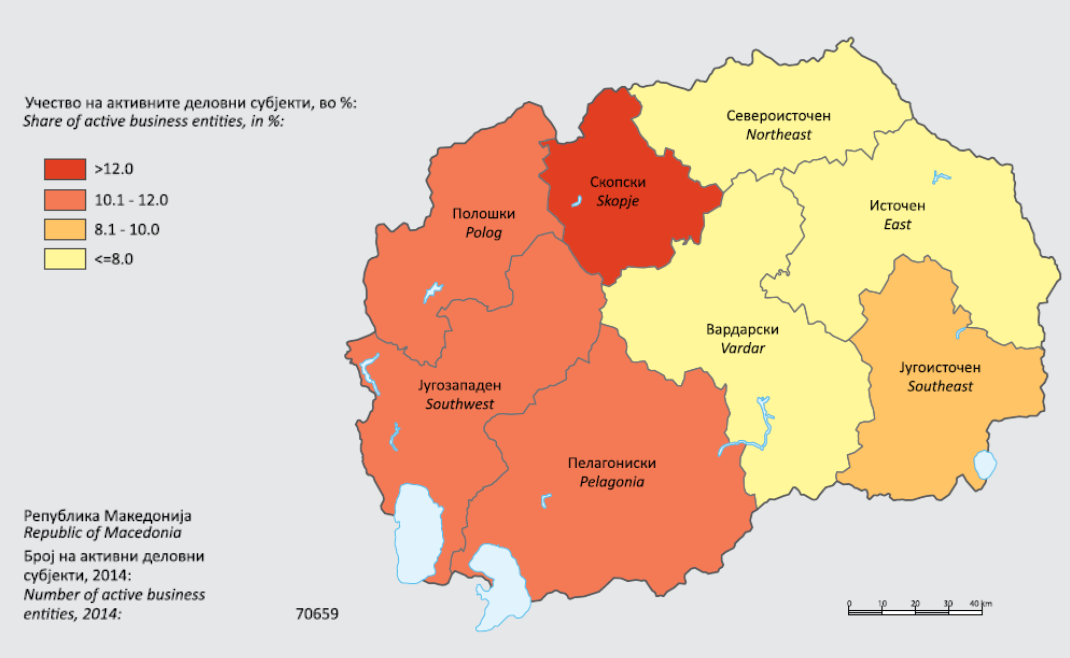
According to the State Statistical Office data, the number of active business entities in 2014 in the South-East region is 5.969 and is 8, 4% from the total number of active business entities in the Republic of Macedonia, which is 70.659. Almost 85% from the total number of active business entities in the South-East region is among businesses entities with 1-9 employees.
Figure: Active business entities 2014

Source: State Statistical Office, The Regions in the Republic of Macedonia, 2015
Structure of business entities by municipalities and dominant industries given separately for each of the municipalities.
In the South-East region, from the total number of 5.969 active business entities, the sector Wholesale and retail trade; repair of cars and motorcycles has the biggest number of active business entities (2.394); the food processing industry is second with 694 business entities, third by number is the transport and storage with 596 active business entities.
Figure: Active business entities by number and sector for South-East region (2014)
{flashchart data="2014/318|12|694|278|2394|596|350" type="bar_simple" tooltip="#x_label#: #val#
>Total #total#" title="Active business entities by number and sector" height="300" dimension="" label_fontsize="11" x_label_rotate="40" x_step="1" legend="Agriculture Forestry and Fisheries,Mining and quarrying,Manufacturing,Civil Engineering,Wholesale and retail trade,Transportation and storage,Accommodation and food service activities"
right_legend="0" bg_image="plugins/content/flashchart/images/pv_system.jpg"}sample05{/flashchart}
Source: State Statistical Office, The Regions in the Republic of Macedonia, 2015
TRADE EXCHANGE
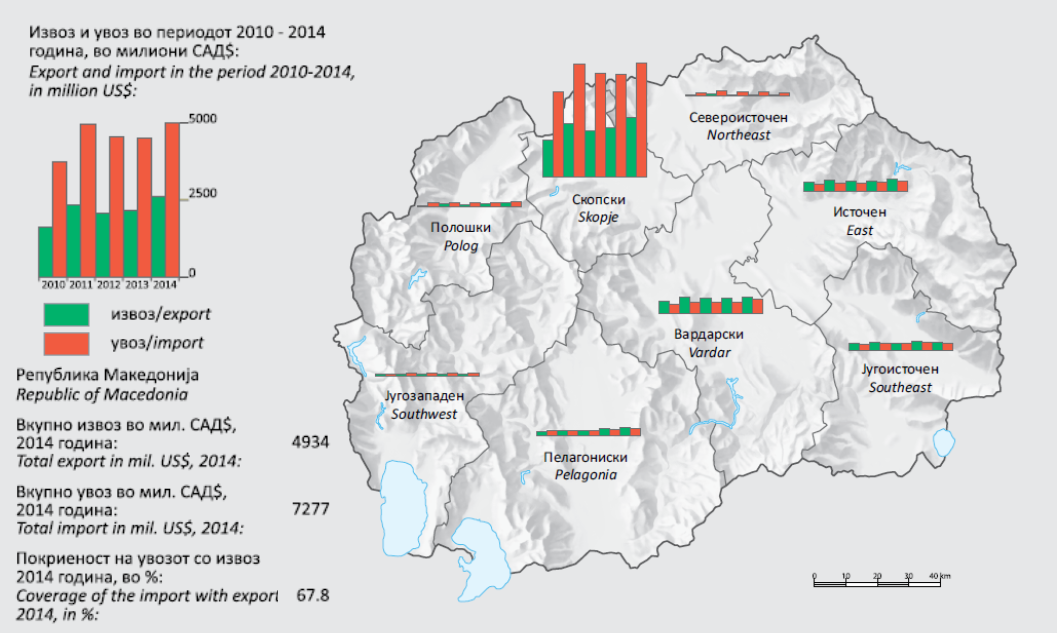
The business entities in the South-Eastern region have made export in amount of 414, 5 million USD, which is 7, 7 % from the total export of the Republic of Macedonia in amount of 4.934 million USD in 2014. In the same time, the import was with value of 320 million USD, which is 4, 4 % from the total import of the Republic of Macedonia in amount of 7.272 million USD. According to this the business entities form the South-East region have made surplus from the external trade exchange in amount of 94, 3 million USD for 2014.
Figure: External trade 2014

Source: State Statistical Office, The Regions in the Republic of Macedonia, 2015

